Field ShiftProject journal
NASA Space Apps Hackathon · 2026

FIELD
SHIFT.

What should a farmer plant next? A project about reading the land from orbit, testing the signals against real harvests, and making crop rotations easier to compare.

Explore the story ↓

Background

Farmers around the world navigate shifting temperatures, changing rainfall patterns, water shortages, extreme weather, and declining soil health. These pressures make it difficult to choose crop rotations that protect fields, conserve water, and support long‑term resilience. To support this cause, we create a decision‑support tool that uses NASA Earth observations along with local soil information, crop characteristics, and farmer priorities to help farmers explore rotation strategies that could strengthen soil health and adapt their farms to changing conditions.

Farmers face increasingly complex decisions as temperatures shift, rainfall becomes less predictable, and soil health declines across many regions. Water shortages, erosion, nutrient depletion, and extreme weather events add further uncertainty. Selecting new crops to add to a rotation can be difficult, because a crop that improves soil health in one place may consume too much water, introduce disease, conflict with local markets, or fall outside expected growing seasons somewhere else.

NASA Space Apps Challenge 2026 · Adapting Farms with NASA Data ↗

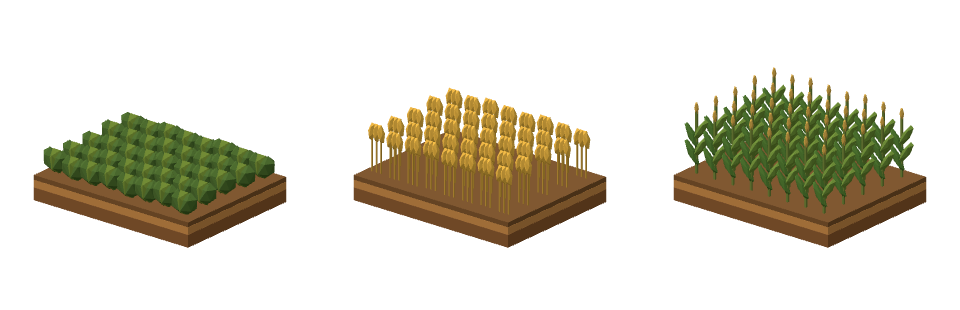
Three views of the same soil plot, with low leafy rows, golden wheat heads and tall corn stalks in succession.
  1. Year 1Soybeans
  2. Year 2Wheat
  3. Year 3Corn

What should I plant next, and why?

Our aim in this challenge was to build Field Shift, a tool for comparing crop rotations. We looked for patterns between NASA weather observations and actual harvests across countries, then brought that evidence together with local soil data and farmers’ priorities to help them weigh their options.

How did we approach the problem?

Step 1 Make sense of NASA data.

What did we measure?

From 2008 to 2024, we studied three contrasting counties: Imperial in California, Grand Forks in North Dakota, and Palm Beach in Florida. We tested ten potential growing constraints against two outcomes: harvested yield and canopy greenness.

Data and sources

We paired daily NASA POWER weather readings with annual USDA county yields and checked the weather against Daymet. USDA soil records described local growing conditions. We used USDA crop maps to identify each crop and NASA MODIS observations to measure its monthly greenness.

For crops with at least ten years of records, we checked which weather measures tracked yield or greenness. We tested the two strongest measures on years left out of the analysis.

USDA yield records · USDA crop maps · USDA soil data

Which weather conditions tracked yield?

We fitted the weather measures together using ridge regression so related signals, such as heat and evaporation, could share weight. We tested each crop’s function on states left out of training and compared its predictions with a shuffled-year benchmark.

Weather and yield across U.S. states, 2008–2024
CornSoybeansWinter wheatOats
Rain+0.19+0.26−0.04+0.10
Root-zone wetness+0.19+0.18−0.04−0.08
Rain − evaporation+0.26+0.32−0.05+0.11
Longest dry spell−0.09−0.20−0.09−0.10
Evaporation demand−0.39−0.43+0.04−0.13
Mean temperature−0.38−0.41+0.02−0.16
Growing degree days−0.39−0.41−0.08−0.22
Heat days (≥30 °C)−0.42−0.44−0.10−0.21
Frost days+0.14+0.14−0.07−0.07
Coldest night−0.17−0.23+0.07−0.04

Blue marks positive correlations and orange marks negative ones. Values closer to zero indicate a weaker relationship.

What did greenness tell us about rotation?

In Grand Forks, July satellite observations showed that spring wheat was usually greener where soybeans had grown the year before than where corn had grown. The Normalized Difference Vegetation Index (NDVI) compares reflected red and near-infrared light to measure canopy greenness.

See all 14 years

Each value is the July NDVI for wheat after soybeans minus the NDVI for wheat after corn. Positive values mean the canopy was greener after soybeans.

  • 2009+0.038
  • 2010+0.026
  • 2011+0.061
  • 2012+0.011
  • 2013+0.018
  • 2014+0.029
  • 2015+0.018
  • 2016-0.047
  • 2017+0.007
  • 2018-0.016
  • 2019+0.003
  • 2020+0.050
  • 2022-0.014
  • 2024-0.007

Step 2 Learn across countries.

To compare places with very different climates, we measured each season against the region’s own history. For a given crop, each contributing country received equal weight so the largest dataset could not dominate the fit.

Training countries

  • United States
  • Spain
  • Brazil
  • Poland

One function per crop

Give each country equal weight. Use growing-season weather to estimate how far yield will move from its usual level.

Test in Türkiye

Apply the function to NASA weather from a country whose harvests were held out of training.

Step 3 Test one country at a time.

First we tested each country’s crop models on regions left out of training. Then we pooled countries, withheld one entire country, and rotated the holdout. Read across a crop’s row to see where its weather relationship travelled.

Crops that passed within each country

Each bar counts crops whose weather model beat chance in regions left out of training. Select a country to highlight its column.

How well did the model travel?

CropUSSpainBrazilPoland
Maize+16% ✓-17% fails+0.4% ✓+16% ✓
Wheat-15% fails+29% ✓+3% ✓+22% ✓
Barley+5% ✓+21% ✓-2% fails+14% ✓
Oats+3% ✓+25% ✓-11% fails+36% ✓
Soybeans+15% ✓No data+13% ✓+3% fails
Sorghum+18% ✓+38% ✓+0.1% ✓No data

Each percentage measures how much year-to-year yield variation the model explained in the held-out country. A check marks a score that beat chance. 17 of 22 tests passed. A climate term improved predictions for wheat, rye and sorghum.

Check the estimates against documented events.

We checked the global estimates against actual harvests in Türkiye, a country outside training. In 2021 the model picked up part of the drought loss. In 2014 it missed the frost loss. Both estimates used weather observed during the growing season.

Common wheat in Türkiye

Yield above or below trend (%)
Recorded (Eurostat)Estimated
  1. ’11
  2. ’12
  3. ’14
  4. ’15
  5. ’16
  6. ’17
  7. ’18
  8. ’19
  9. ’20
  10. ’21
  11. ’22
  12. ’23
  13. ’24

Six of 15 Turkish crops passed, covering 76% of the tested crop area. For wheat, the model explained 15% of year-to-year variation. After a warning, a loss of at least 15% followed 24% of the time, compared with 13% in an ordinary year.

What the event tests caught

7 of 9 droughts
The model flagged drought in the most affected regions and predicted about a third of the loss.
2 of 4 frosts
It predicted about a tenth of the frost loss. Michigan apple yields fell 87%, against an estimated 12%.
2025 wheat in Türkiye
The model estimated a 1% loss. The recorded loss was 14% after record-cold April nights.

The Rotation Explorer includes 136 regions in four countries and tags bad-weather losses by crop.

Try The Rotation Explorer!

Choose a region, set your priorities, and select Run to compare crop rotations with the regional baseline.

Farm Planner Open in new tab ↗